
Data Visualizations
BACKGROUND
As part of the long-standing sponsorship, John Hancock supported B.A.A. (Boston Athletic Association) by providing resources and funding for a small team that organizes the iconic Boston Marathon. From 2010-2018 our design team have been responsible for developing digital assets for John Hancock marketing campaign, as well as digital marketing assets for the media campaign spearheaded by the B.A.A.
Challenge
Although the B.A.A. had a 100 years worth of Boston Maratnon data, the data existing only in printed format and was hardly digestible by a non-professional. We wanted to use that data to get community and public, as well as media partners, excited about the upcoming race.
PRocess
The digital activation consisted of the following parts:
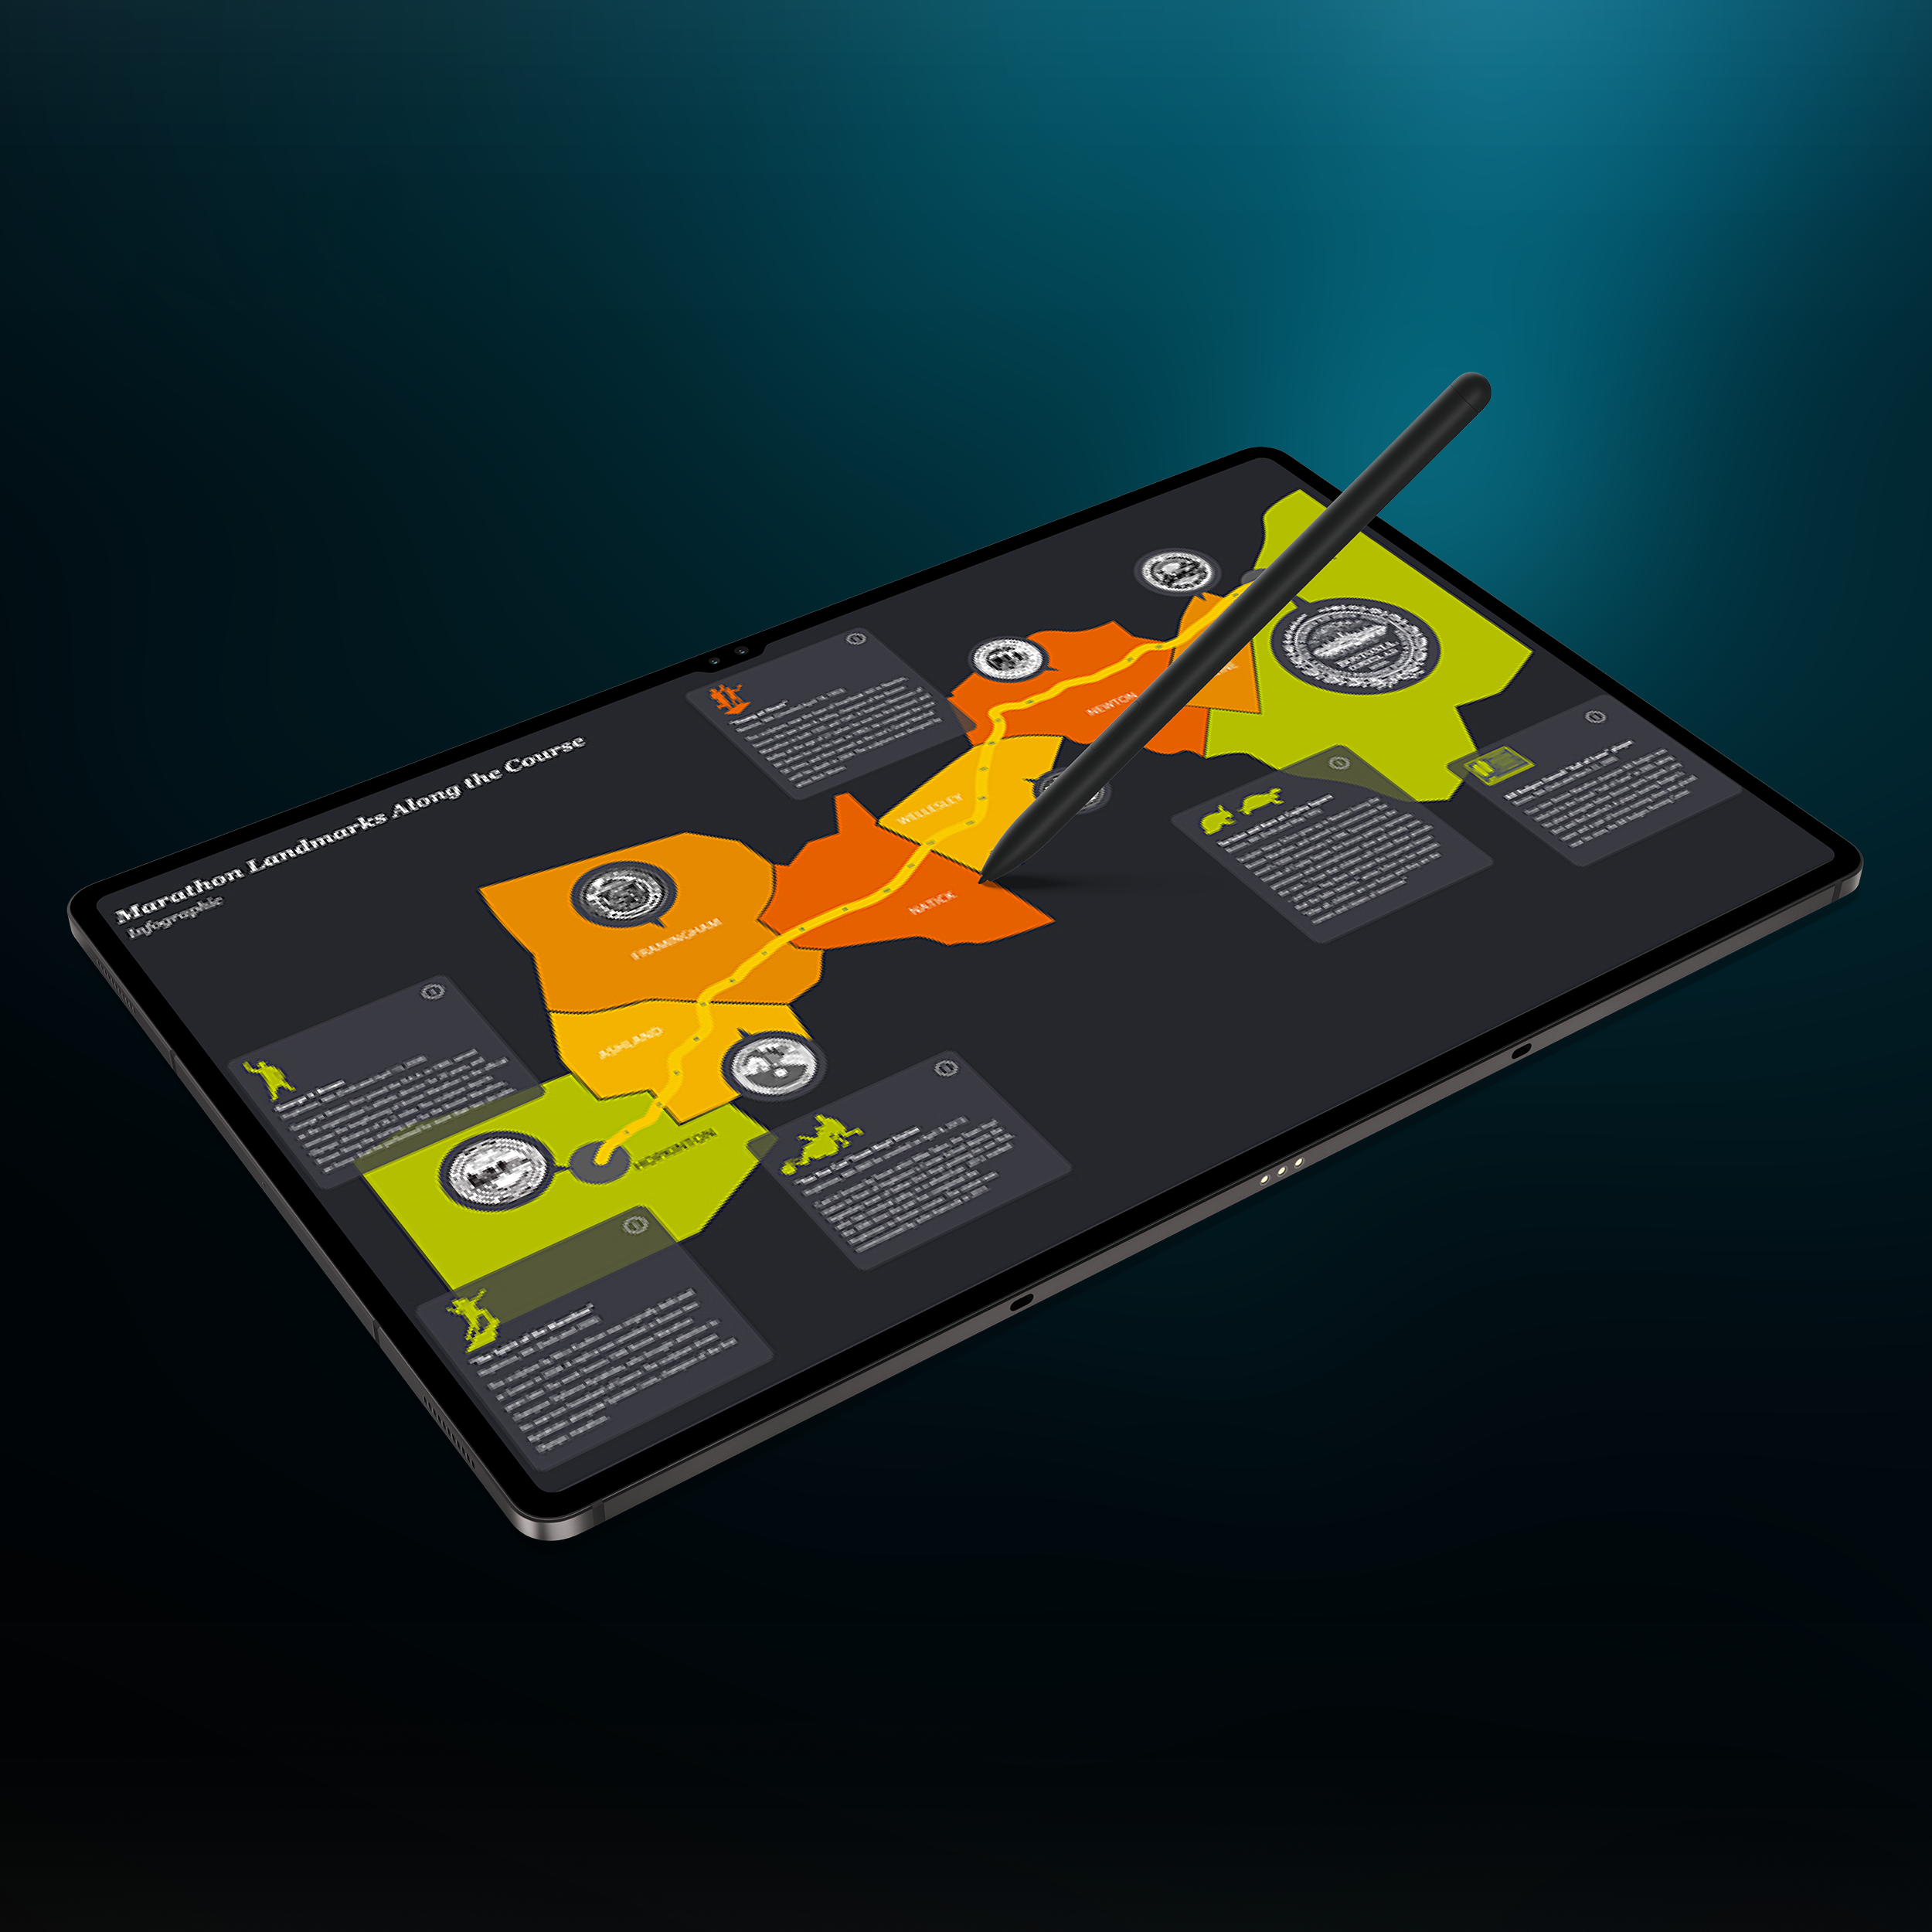
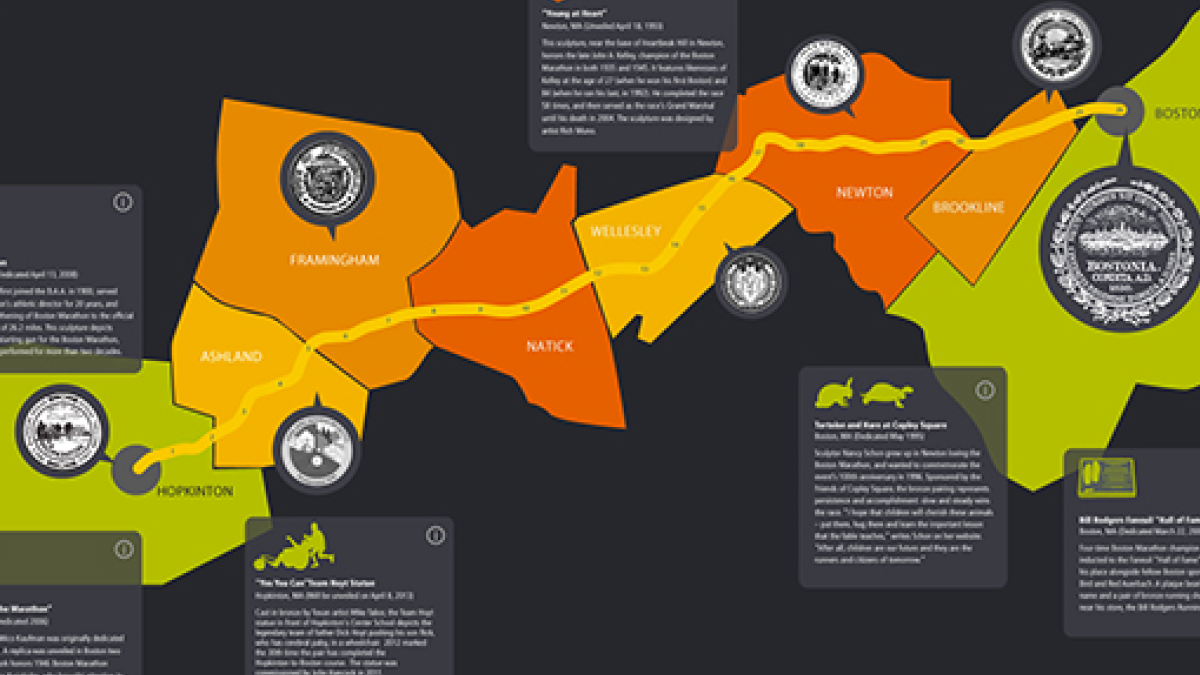
Moving the entire data set to a digital space, which would allow us to produce an online guide for the media, accessible by their mobile phone during the race.
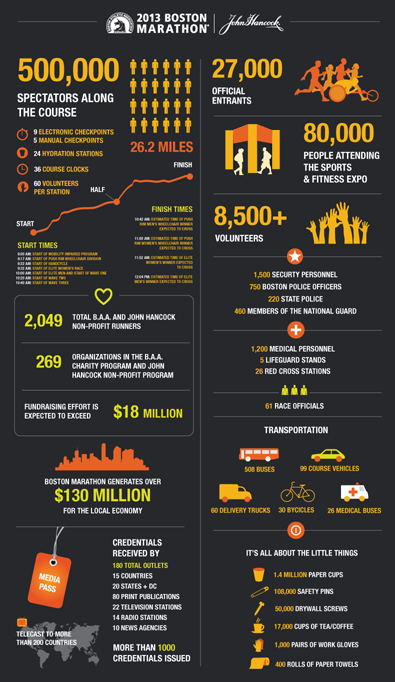
Developing a set of supporting infographics with tid bits of shareble data that could be used in social activation.
REsults
We have developed a set of infographics that met the social team’s business goals by getting a great number of impressions across social networks.
By converting the printed media guide to a digital experience, we have reduced the number of hours our team had to spend yearly updating the statistics for the printed version of the media guide by over 85%.